The 4 most important Financial Management Control metrics

Today we invite you to tour with us 4 of the most important Management Control #metrics. We have selected four indicators that, in our opinion, are among the most useful to take into account when analyzing the deviation of budgets in a company.
Management control: Definition
Before we begin, we’d like to review a simple definition. #Managementcontrol is the administrative process by which an organization carries out a Plan and, as it is executed, takes the necessary measures to accompany that evolution in a controlled manner.
Through #financialindicators and metrics, the company can thus see and evaluate how the operation is developing. That is, if it operates within the Plan’s guidelines or if deviations are being made (for this reason it is often called «control of deviations»).
The variation of the budget is identified by some of the most important metrics of management control. Next, we dive into this topic, continue reading!
What does a «Controller» or «Responsible for Management Control» profile do?
Management control is carried out by the role of the #controller, who is responsible for executing the tools and processes that are triggered in a management control. Any situation that arises in the Management Control department is its area of responsibility.
The controller, logically, has a crucial performance when it comes to surveying, presenting and analyzing the most important metrics of management control. Among his skills are the technical skills, typical of all finance professionals, but he must also have other very specific and difficult to acquire skills, such as good relationships with area managers and in-depth knowledge of the identity, culture and processes of the company. business.
Metrics for Management Control in a company
The budget variance analysis consists of comparing the real result of the operation against what we had defined in the budget. Through this comparison we have as a result the variations, which are nothing more and nothing less than the deviations.
Now yes, let’s get to know what are the most important metrics of Management Control.
#1 Budget variance versus previous period, latest forecast, and initial budget
To make the #budget for the current period, a company probably started and consulted the previous period, what projections were made. Starting from this historical base, after adjustments to it and decentralization among those responsible, the projection for the period is formed.
Said projection can ideally be compared against real, accounting, or historical information, however we want to tell it, that is, what the organization is effectively executing. This information usually comes from an Accounting Information System or ERP, although sometimes companies have more than one source, or simply Excel files sent by their Accounting Study month after month.
Although comparing budget versus actual is the first key look when analyzing deviations, at some point in the year we will no longer compare only the annual budget, but the last forecast made, which will give us a fresher view of the projection. In addition to this, having the comparison against the previous period executed, can give us a better temporary vision of the performance of the business.
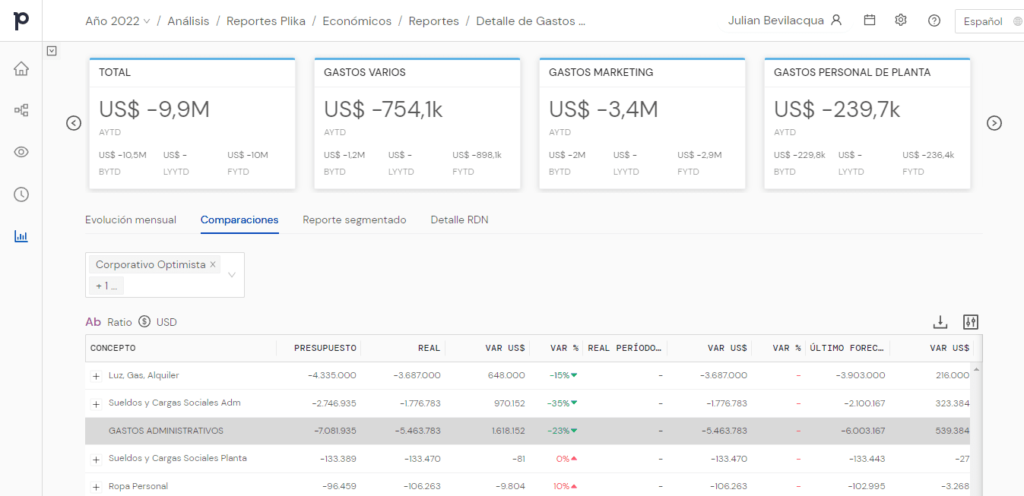
For example, in Plika, we can see a standard report that shows the Income Statement with parallel columns.
#2 Budget variance versus the average of the last three years
Another of the most important metrics of Management Control is the data that results between the comparison of the real budget (what we have been spending) against the average of the last three years or X years that the business considers, in order to have a vision of inter-annual evolution.
Here we must consider, in inflationary contexts like the current one, the data of the increase in #prices. Having brought the current and average numbers to a base index, we will be able to compare how the business is spending in relation to previous years and thus identify which items grew, which decreased, etc.
#3 Time of the monthly deviation reporting process
A key metric is the time spent on #Reporting tasks. Every month the controller’s team prepares a package of reports and presentations, many of which (most of them usually) are repeated month after month.
Here the use of an FP&A software tool like Plika can ease, reduce and even eliminate these pains, helping the finance team to have better times by automating tasks.
Downloading the «real» accounting information data is usually something that takes a long time, but making a relationship against the structure proposed for the budgets (which usually differs) is what usually costs a finance team the most at the monthly Reporting time level. . Relating accounting to budget management is one of the challenges that an FP&A Software comes to solve.
An FP&A solution can facilitate the updating of reports simply by refreshing the database, impacting the presentation and updating the information in it in just a few seconds.
#4 Closing time
The #closingtime is the time required by the controller and the finance team of the organization to complete all the tasks corresponding to the accounting and management closing of a certain period.
As with Reporting, the monthly or annual closures of a company’s accounts involve a large number of repetitive tasks. The implementation of a software solution that improves the times in each iteration ends up being an investment with a fast return.
The closing time has an expected value that tends to 0. That is, the closer the metric is to 0, the better the performance of the financial team.
Final notes
Whatever your favorite metric is, it is very important that you and your team work on reliable data. The certainty and reliability of the data is fundamental, because therein lies the security of all the budget projections and revisions that will be made later.
In this sense, we want to recommend that you read an article that we have made specifically for you (you can read it by clicking h. A good FP&A tool like Plika is an ideal helper for:
- achieve fluidity in the financial and administrative processes of management control,
- achieving superior efficiency thanks to the automation of repetitive tasks,
- improve the communication of information, by providing us with a complete set of functionalities that allow us to make quality presentations and
ensure the reliability of the data, by allowing the integration of the FP&A solution with the accounting software (be it Odoo, with which there is an alliance, or any other), thus accessing the original data package directly and easily updatable.
See you again in the next post! remember to leave us your most important management control metrics!
